Lab Notes: XPU Manager 2.0 finally lets me delete my custom image
This note documents the cleanup path from a patched custom XPU Manager deployment to the upstream XPUMD 2.0 Helm chart for Intel GPU telemetry in my Kubernetes homelab.
Disclaimer: This is lab documentation, not production guidance. It describes what changed in my cluster and why I am happy to delete a workaround.
Table of Contents
- 00 Finally, a boring XPU Manager install
- 01 What I used to do
- 02 The DRA monitor shape I was patching toward
- 03 What changed upstream
- 04 The new shape in my cluster
- 05 The metric name situation
- 06 What this removes from my life
00 Finally, a boring XPU Manager install
This is a small update, but it removes one of the uglier pieces of my GPU observability setup.
Intel XPU Manager has been one of those pieces in my homelab that I needed, but did not particularly enjoy maintaining.
I wanted GPU telemetry from the Intel Arc cards in my Kubernetes cluster. For a while, the implementation was very ugly.
Now XPU Manager 2.0 ships an upstream OCI Helm chart:
oci://ghcr.io/intel/xpumanager/charts/xpumdThe chart pulls the upstream image:
ghcr.io/intel/xpumanager/xpumd:v2.0.001 What I used to do
The old setup in my GitOps repo was not something I was proud of.
I had a Flux GitRepository pointed at intel/xpumanager, then a Flux Kustomization pointed into the upstream Kubernetes DaemonSet base.
On top of that I patched the DaemonSet hard enough to make it fit my cluster:
- replace both container images
- add a GPU-node toleration
- force scheduling to
sonda-core - add a DRA
ResourceClaimTemplate - attach the DRA claim to the container resources
- remove the original GPU resource limits
- set
ZES_ENABLE_SYSMAN=1 - maintain a separate Service on port
29999 - maintain a separate ServiceMonitor
The image was the worst part.
I had a custom image under sonda-red/custom-images because the public container image I had been using had gone stale for my needs.
There was also an upstream issue about regularly updating the DockerHub image, which was a good enough signal that I should stop treating that path as dependable for this setup.
That was not some clever platform abstraction. It was just a workaround that became infrastructure.
The Dockerfile did more than I want a lab image to do:
- build on Ubuntu 24.04
- install a Python virtual environment
- pull the XPUM
1.3.7deb from the GitHub release - install Intel GPU userspace packages
- create an entrypoint that started
xpumd - expose the old REST exporter path through Gunicorn
In rough terms, it was this shape:
ubuntu:24.04
  -> Python venv
  -> Flask / prometheus-client / grpcio / protobuf / gunicorn
  -> Intel graphics PPA packages
  -> xpumanager_1.3.7_...u24.04_amd64.deb
  -> custom entrypoint
  -> xpumd + REST exporter on port 29999
My old active image looked like this in the manifests:
ghcr.io/sonda-red/xpumanager@sha256:...That is useful when you need to unblock yourself. It is not where I want the lab to stay.
This is the kind of thing that works, becomes normal, and then becomes suspicious because you cannot quite remember why all of it exists.
02 The DRA monitor shape I was patching toward
The other reason my old setup became awkward was DRA.
I have written about DRA a few times in this series already, so I will not re-explain the whole model here. The specific part that matters for this note is monitor access.
Intel’s GPU DRA monitor deployment documentation includes a monitor pod example using a ResourceClaimTemplate with monitor-style access.
The YAML is verbose, but the important part is the claim shape:
apiVersion: resource.k8s.io/v1
kind: ResourceClaimTemplate
metadata:
  name: monitor-claim
spec:
  spec:
    devices:
      requests:
        - name: gpu
          exactly:
            deviceClassName: gpu.intel.com
            adminAccess: true
            allocationMode: "All"
            tolerations:
              - effect: NoExecute
              - effect: NoSchedule
---
apiVersion: v1
kind: Pod
metadata:
  name: monitor-pod
spec:
  restartPolicy: Never
  containers:
    - name: monitor
      image: registry.k8s.io/e2e-test-images/busybox:1.29-2
      command: ["sh", "-c", "ls -la /dev/dri/ && sleep 60"]
      resources:
        claims:
          - name: resource
  resourceClaims:
    - name: resource
      resourceClaimTemplateName: monitor-claim
The important distinction is:
- a normal inference pod should request the GPU resources it needs
- a monitor needs visibility into devices on the node
- the monitor should not make those devices unavailable to actual workloads
So the shape I wanted was clear:
DaemonSet
  -> runs on the GPU node
  -> gets DRA monitor access
  -> exposes Prometheus metrics
  -> does not consume a normal GPU allocation
The problem was that I was assembling that shape myself by patching upstream manifests after the fact.
03 What changed upstream
XPU Manager 2.0 changes the shape quite a bit. The upstream XPUM 1.x vs 2.x changes cover the broader redesign; the part that mattered for my cluster was the exporter and deployment shape.
The old 1.x world had a C++ daemon and a separate Python exporter path. Metrics came out with XPUM-specific names like:
xpum_power_watts
xpum_temperature_celsius
xpum_memory_used_bytes
XPUMD 2.x is a Go daemon built around OpenTelemetry components and Level Zero Go bindings. The Prometheus endpoint is still there, but the exported metric names now follow OpenTelemetry-style conventions, for example:
hw_gpu_utilization_ratio
hw_temperature_celsius
hw_memory_usage_bytes
The chart also understands GPU monitor access directly:
gpuAccess: draThat single value is the part I had been patching toward. It tells the chart to use the monitor shape above instead of making me splice that behavior into the DaemonSet after rendering.
So instead of patching the upstream DaemonSet after the fact, I can tell the chart what I mean.
04 The new shape in my cluster
The new local module is much simpler.
First, the OCI chart source:
apiVersion: source.toolkit.fluxcd.io/v1
kind: HelmRepository
metadata:
  name: xpumanager
  namespace: intel
spec:
  interval: 1m
  type: oci
  url: oci://ghcr.io/intel/xpumanager/charts
Then the HelmRelease:
apiVersion: helm.toolkit.fluxcd.io/v2
kind: HelmRelease
metadata:
  name: xpumanager
  namespace: intel
spec:
  interval: 5m
  chart:
    spec:
      chart: xpumd
      version: 2.0.0
      sourceRef:
        kind: HelmRepository
        name: xpumanager
        namespace: intel
And the values that matter for my cluster:
fullnameOverride: intel-xpumanager

image:
  repository: ghcr.io/intel/xpumanager/xpumd
  tag: "v2.0.0"

gpuAccess: dra

nodeSelector:
  kubernetes.io/hostname: sonda-core

tolerations:
  - key: dedicated
    operator: Equal
    value: gpu
    effect: PreferNoSchedule

extraEnv:
  - name: ZES_ENABLE_SYSMAN
    value: "1"

prometheus:
  monitor: true
  release: kube-prometheus-stack

config:
  service:
    pipelines:
      metrics:
        receivers: [intelxpu]
        processors: [intelxpustatus]
        exporters: [intelxpuinfo, prometheus]
In my lab, I hardcode the hostname because sonda-core is the GPU node.
In a larger cluster, I would use GPU node labels, for example labels from Node Feature Discovery, instead of binding the monitor DaemonSet to a specific node name.
With these values enabled, the chart now creates the pieces I used to maintain locally:
ServiceAccountConfigMapDaemonSetServiceResourceClaimTemplateServiceMonitor
05 The metric name situation
My old local dashboard queried xpum_* metrics. That dashboard had to go because XPUMD 2.x exposes different metric names.
I switched Grafana provisioning to the tagged upstream 2.0.0 dashboard:
https://raw.githubusercontent.com/intel/xpumanager/refs/tags/v2.0.0/xpumd/charts/xpumd/json/dashboard.jsonAfter switching the dashboard provisioning, the new panels came back like this:
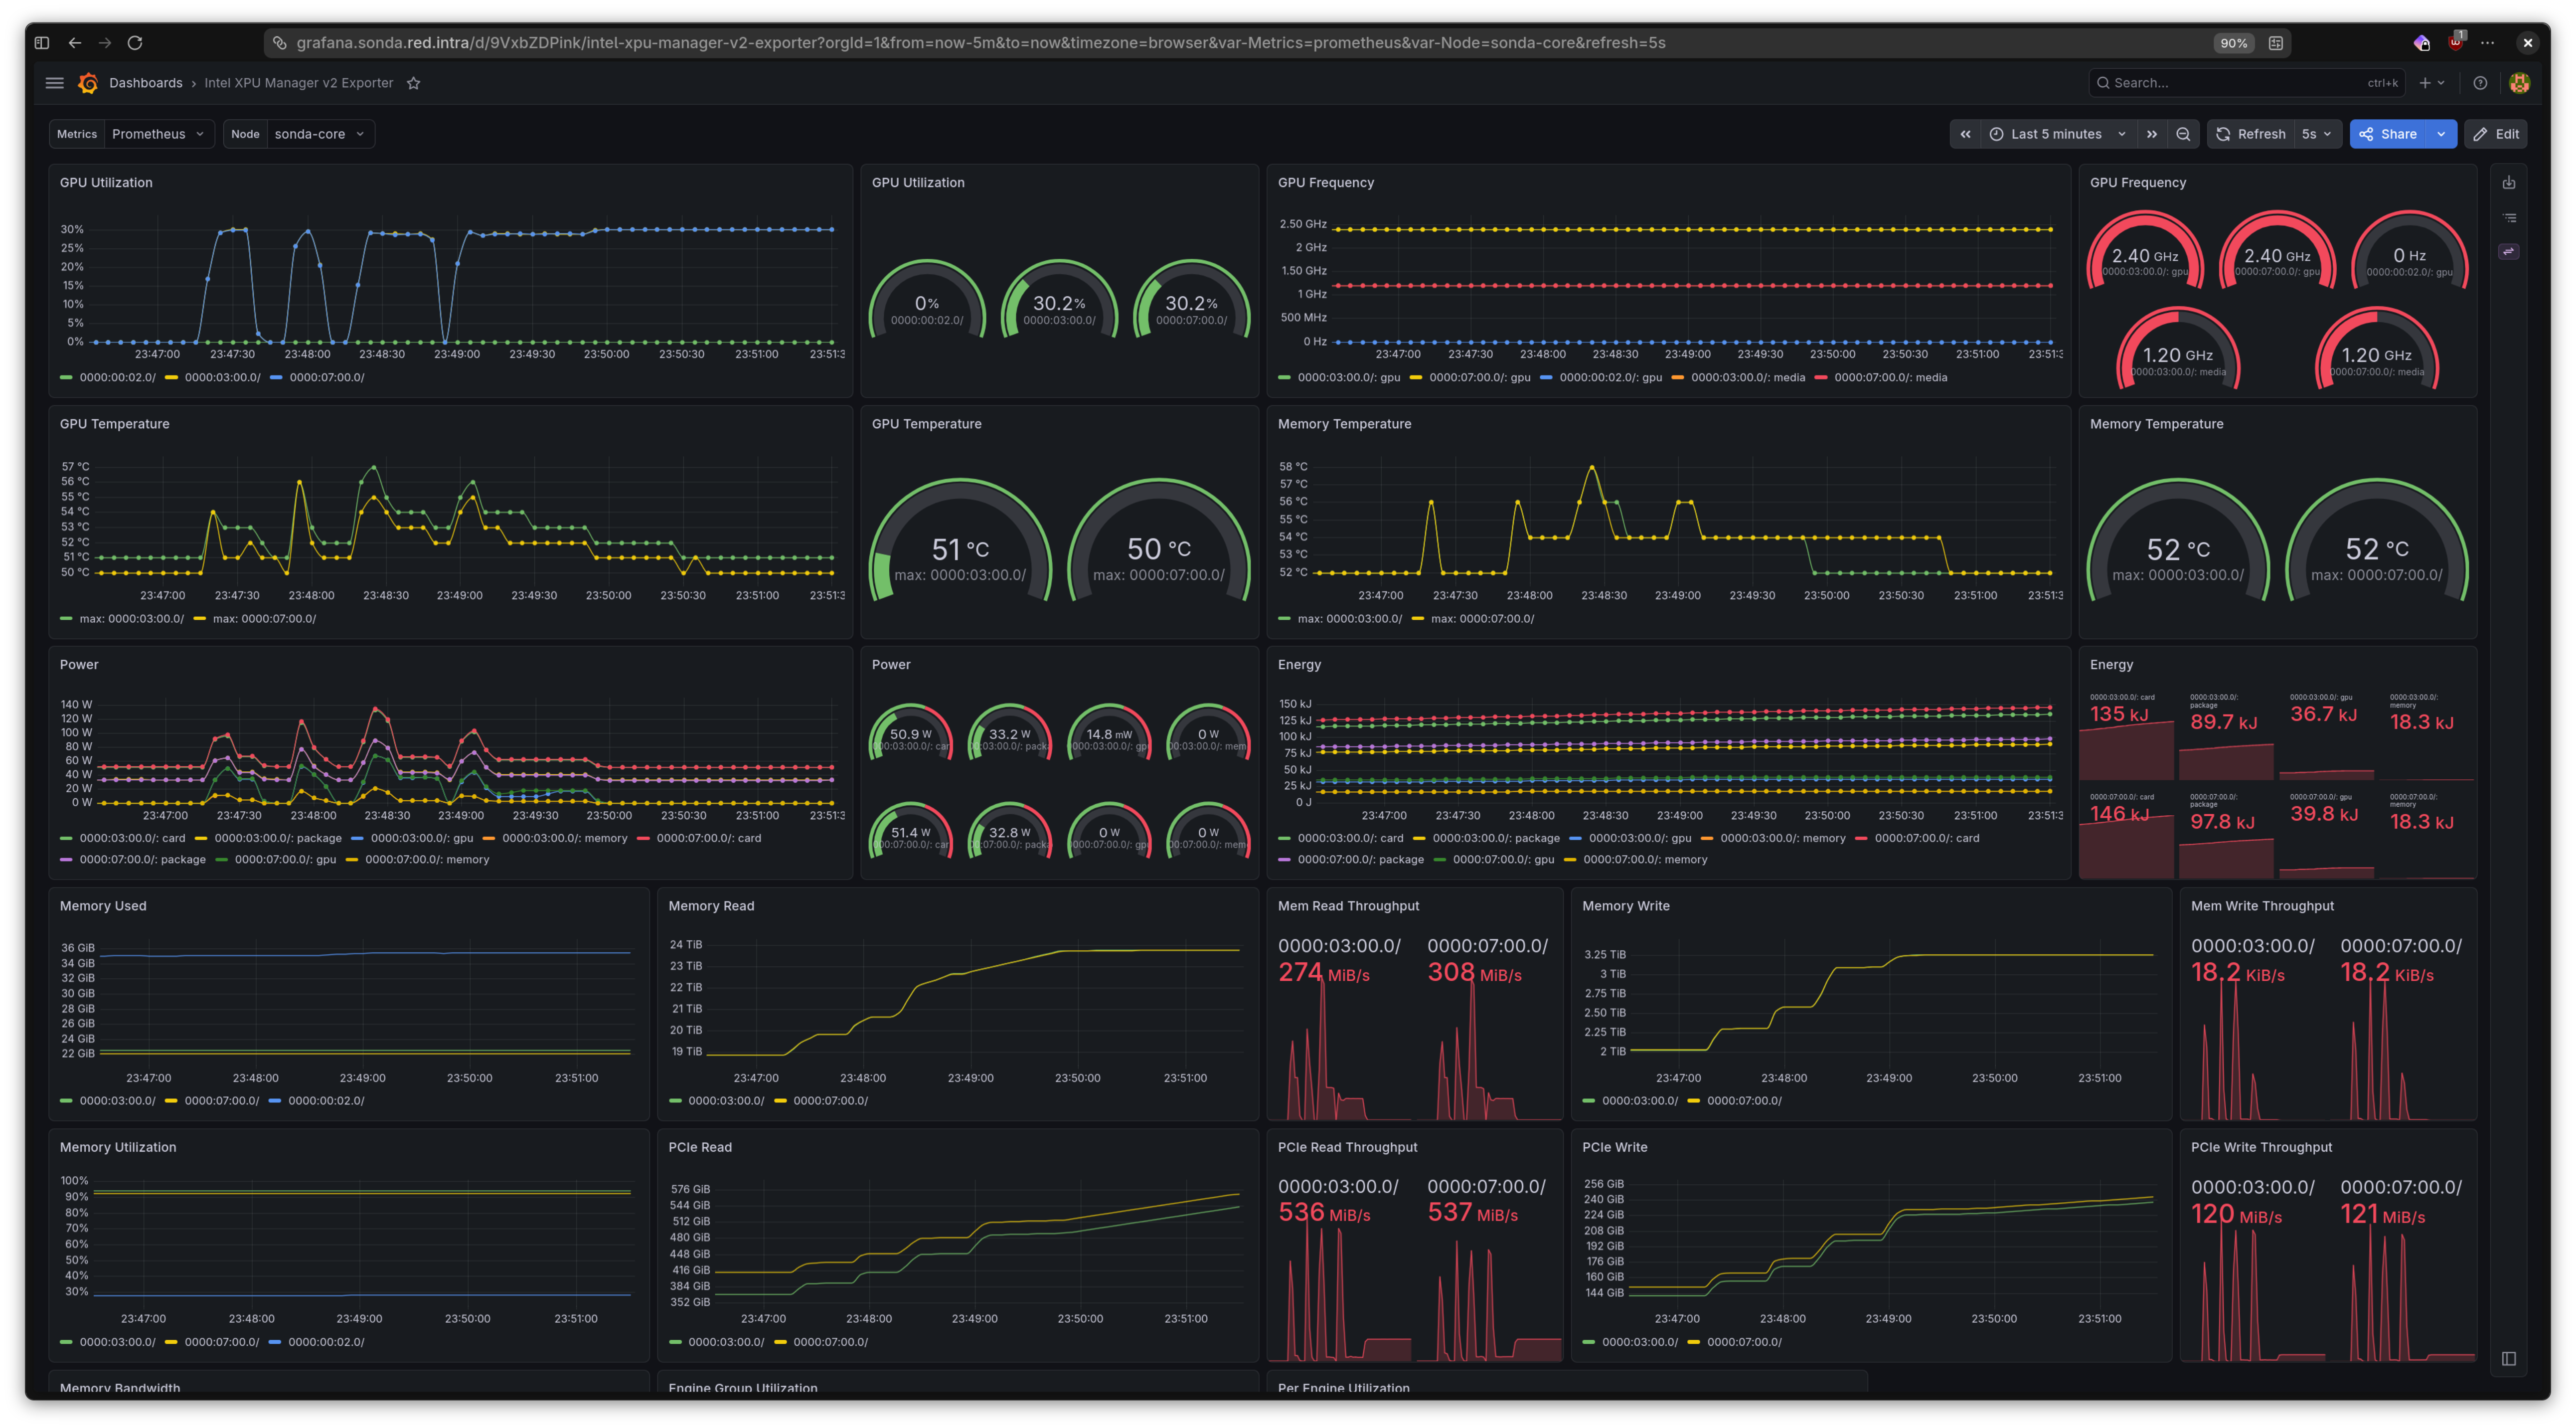
Examples of the new metric shape:
avg by (pci_bdf) (hw_gpu_utilization_ratio{node="$Node"})hw_temperature_celsius{statistic="max", node="$Node", hw_sensor_location="gpu"}hw_memory_usage_bytes{node="$Node"} / hw_memory_size_bytes{node="$Node"}I like this direction. The names are less tied to XPUM internals and more aligned with the broader telemetry ecosystem.
The practical migration note is simple: the pods can be healthy while the dashboard is blank. Check the metric names before blaming Prometheus.
06 What this removes from my life
This is what I got to delete or stop caring about:
- my custom
ghcr.io/sonda-red/xpumanagerimage - the custom Dockerfile that rebuilt XPUM 1.x around Ubuntu, Python, Gunicorn, and Intel userspace packages
- the patched upstream DaemonSet source
- the separate XPU Manager Service
- the separate ServiceMonitor Kustomization
- the hand-written monitor
ResourceClaimTemplate - the old
xpum_*dashboard - the Renovate custom manager that tracked XPU Manager as a Git tag
I do not regret the custom image. It got me telemetry when I needed telemetry.
In this case, the final result is boring, but that is a good thing. I can delete the workaround and move on.
Flux HelmRelease
  -> upstream xpumd chart 2.0.0
  -> upstream xpumd image v2.0.0
  -> chart-managed DRA monitor claim
  -> chart-managed ServiceMonitor
  -> upstream XPUMD 2 dashboard